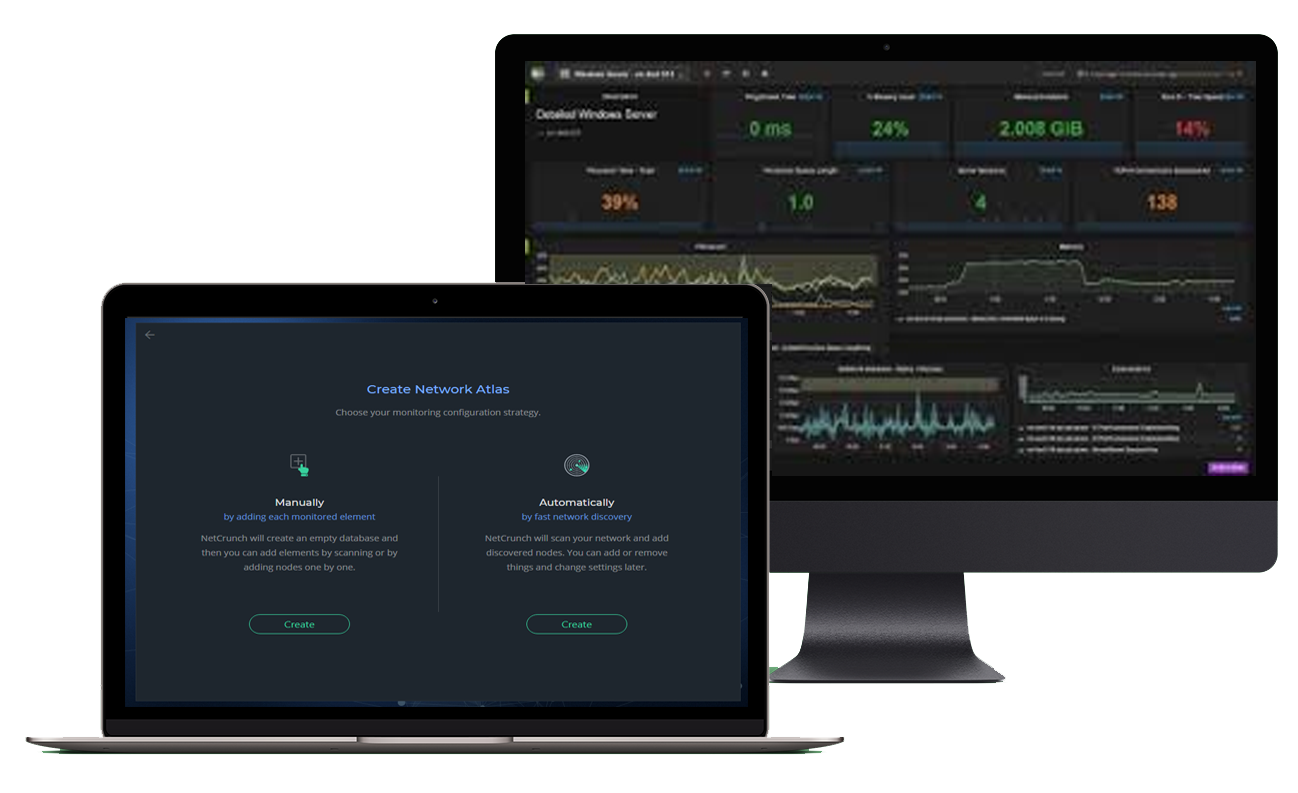
Network monitoring that’s powerful, scalable & doesn’t need a team of PHD scientists to run. It's time to work smarter, not harder.
A good network monitoring tool is one of the most import tools of an IT department. It watches over your network and servers, and alerts you when something is wrong, helping you to keep one step ahead of problems. Monitoring can be a tedious task but, with a total integrated network monitoring solution that can be set up in hours (and won’t cost you the bank), you can stop wasting time and start receiving comprehensive monitoring, flexible visualisation, alerting and policy-based configuration in minutes or hours, not days or weeks.
Our solutions are out of the box, easy to install and a breeze to configure.
snmp devices
Monitor any SNMP devices including switches and firewalls, get all pre-compiled MIBS and comprehensive alerting features.
You can also check performance and availability of over 70 network services (such as PING, HTTP, LDAP, CIFS/SMB, SQL).
performance monitor
Get a comprehensive package, with all SNMP features and network services monitoring. Monitor logs, operating systems, virtualization, SQL databases, WMI, IPMI, Web, Cloud and more. Includes over 250 Monitoring Packs and application sensors.
Network infrastructure
Monitor and map your network infrastructure with SNMP regardless of your vendor solutions.
Easily track bandwidth and traffic through flows (Netflow, NBAR, sFlow, and other flow protocol supported).
Monitoring Suite
Complete all-in-one package with all advanced features necessary for managing a high number of monitored elements.
Discover…
the system that delivers comprehensive monitoring, through extensive (agent-less) monitoring, flexible visualisation, alerting and policy-based configuration.
Easy to Install & Configure
NetCrunch installs quickly because no additional software is required (just Windows x64, 3.5GB, 2 Cores), then it will discover your network in minutes and you can tweak configuration created for you.
Policy Based Configuration
NetCrunch is configured mostly by rules (policies). Monitoring Packs define metrics, triggers, and observed events. You have notification profiles, user profile, action scripts, sensor templates.
Fast, Responsive and Scalable
NetCrunch is probably the fastest monitoring system you've ever seen. It's monitoring in production about 400,000 metrics and 30,000 interfaces on a single system which is less than half of the program capacity.

DOWNLOADS
Try NetCrunch Platform Products
Try the full version of any NetCrunch products and modules, by downloading and installing NetCrunch Platform Server.
Try all modules for 30 days after registering your trial or try the program for 7 days without registration.
Minimum System Requirements for Evaluation
Windows 7 64bit or newer or Windows Server 2008R2 or newer 2 Cores, 3.5 GB RAM, 5 GB Free Disk space.
The trial version is limited to 10,000 nodes/interfaces.
Please contact us if you need more to try.
⚉ ⚉ ⚉
RESOURCES:
NetCrunch Platform Server
Monitoring server, desktop console, web server, and the event database.
(945.6MB)
Additional Downloads:
Administration Console
Desktop console for remote administration of NetCrunch from any Windows machine
(219.5MB)
Remote Probe
Lightweight remote probe for monitoring behind NAT and firewall
(68.2MB)
GrafCrunch Dashboard Server
Fork of open source project Grafana, working with NetCrunch performance data
(58.4MB)

EXPLORE
TAKE A TEST DRIVE
Request a Demo and See How Easy it is to Start Monitoring Today
LISTEN UP
What Makes NetCrunch Network Monitoring System Unique?
GET A QUOTE
Competitive Prices, Purchase Advice, Training and Consulting Services.

Comprehensive Monitoring. Totally customisable.


